
We recently asked for your input regarding the Hayward Police Department's customer service, here is what you told us:
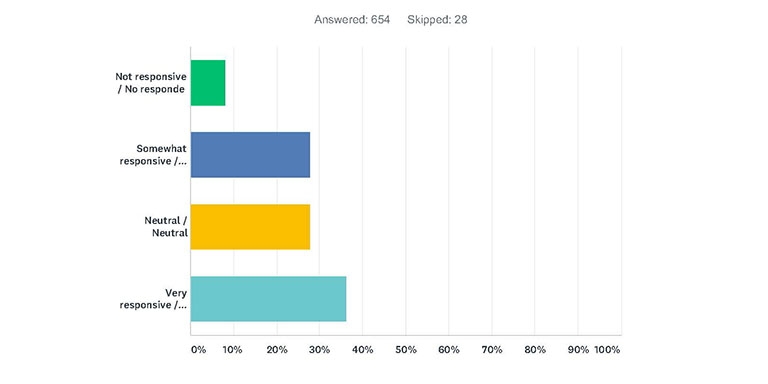
1. Overall, how responsive is the Hayward Police Department in meeting your needs? | ||
Image
| ||
| Answer Choices | Responses | |
| Not responsive | 8.10% | 53 |
| Somewhat responsive | 27.83% | 182 |
| Neutral | 27.83% | 182 |
| Very responsive | 36.24% | 237 |
| TOTAL | 654 | |
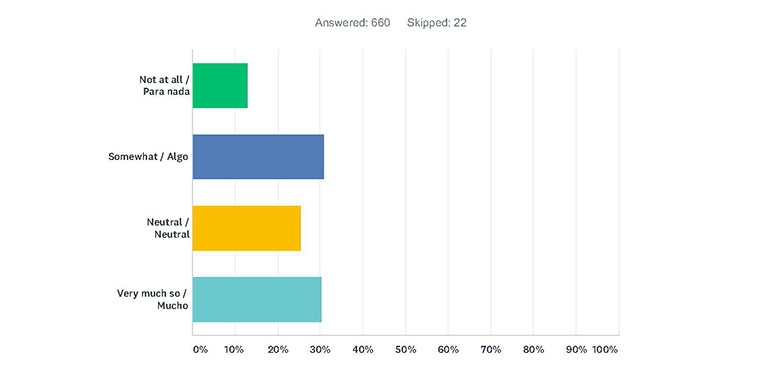
2. I feel that the Hayward Police Department understands my concerns and takes the proper steps to address problems in my neighborhood. | ||
Image
| ||
| Answer Choices | Responses | |
| Not at all | 13.03% | 86 |
| Somewhat | 31.06% | 205 |
| Neutral | 25.61% | 169 |
| Very much so | 30.30% | 200 |
| TOTAL | 660 | |
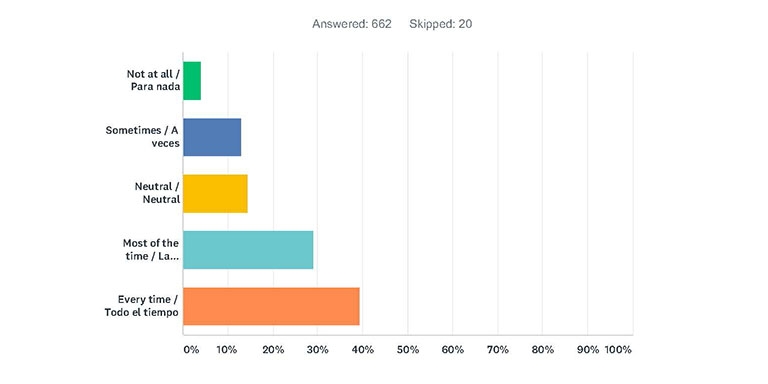
3. I feel that Hayward Police Department employees are courteous, respectful and professional when interacting with me or other community members. | ||
Image
| ||
| Answer Choices | Responses | |
| Not at all | 3.93% | 26 |
| Sometimes | 12.99% | 86 |
| Neutral | 14.50% | 96 |
| Most of the time | 29.15% | 193 |
| Everytime | 39.43% | 261 |
| TOTAL | 662 | |
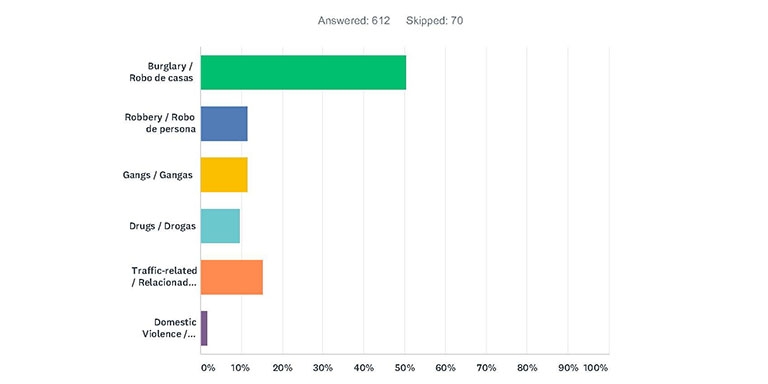
4. What is your primary concern when it comes to crime in Hayward? Please explain in the comment box. | ||
Image
| ||
| Answer Choices | Responses | |
| Burglary | 50.49% | 309 |
| Robbery | 11.60% | 71 |
| Gangs | 11.44% | 70 |
| Drugs | 9.64% | 59 |
| Traffic-related | 15.20% | 93 |
| Domestic Violence | 1.63% | 10 |
| TOTAL | 612 | |
5. What would you like the Hayward Police Department to improve on? More than one answer is acceptable. | ||
Image
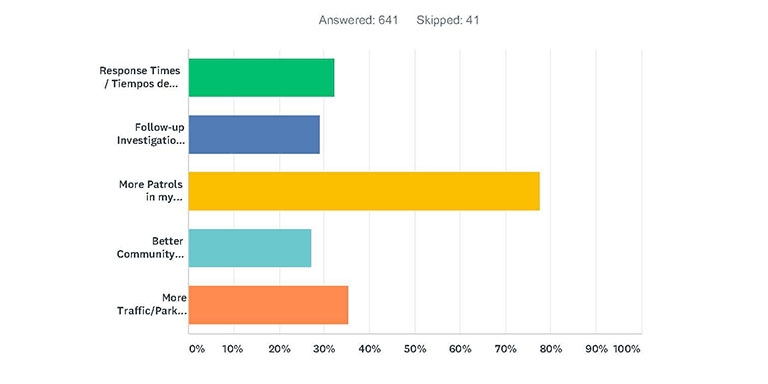
| ||
| Answer Choices | Responses | |
| Response times | 32.14% | 206 |
| Follow-up investigations | 29.17% | 187 |
| More patrols in my neighborhood | 77.54% | 497 |
| Better community engagement | 27.15% | 174 |
| More traffic/parking control | 35.41% | 227 |
| TOTAL RESPONDENTS | 641 | |